
The Rise of Autonomous Agents in 2025 explores practical patterns, platforms, and governance conside...
Real-time Observability: Preventing Critical Failures
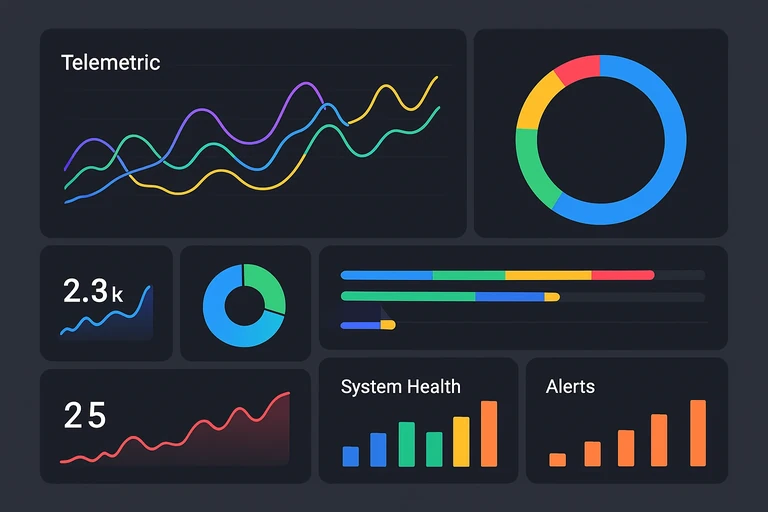
Real-time observability turns telemetry into timely, actionable insights, enabling teams to detect and prevent critical failures before they impact customers. This guide covers MELT, OpenTelemetry, streaming architectures, alerting, and practical steps to design a proactive reliability program.
Introduction
In today’s distributed, cloud-native world, outages don’t just disrupt a single service – they ripple across ecosystems of microservices, data pipelines, and end-user experiences. Real-time observability is the practice of collecting, analyzing, and acting on telemetry as it happens, enabling teams to detect anomalies, diagnose root causes, and prevent critical failures before customers are affected. This post unpacks what real-time observability means, why it matters for reliability and business outcomes, and how to design and implement an effective real-time observability strategy that scales.
Real-time observability is not a luxury; it’s a competitive necessity. It helps teams move from reactive firefighting to proactive resilience, aligns technical and business goals through concrete SLIs/SLOs, and reduces mean time to detection (MTTD) and mean time to recovery (MTTR). Thoughtful observability also supports sustainable engineering by reducing alert fatigue and enabling cleaner post-incident learning.
Note: While the specifics vary by domain, the core ideas below draw on industry practice and widely cited guidance from leading practitioners and standards bodies. For readers who want to dive deeper, resources from IBM, AWS, CNCF/OpenTelemetry, Splunk, and SRE-focused literature provide solid foundations for the concepts discussed here.
1) What is real-time observability—and how does it differ from traditional monitoring?
Observability is the ability to understand the internal state of a system based on the data it emits. Real-time observability emphasizes processing and reacting to telemetry as it streams in, rather than only querying historical data after an problem is suspected. At its core, observability combines three (often extended) pillars of telemetry: metrics, logs, and traces, sometimes augmented by events and synthetic data. A common framing in the industry is MELT (Metrics, Events, Logs, Traces):
- Metrics are quantitative measurements (latency, error rate, throughput, saturation, etc.).
- Events are notable occurrences or state changes (deploys, config changes, feature flags toggled).
- Logs are time-stamped records with contextual details about what happened.
- Traces capture end-to-end journeys across distributed components, enabling root-cause analysis in complex systems.
In practice, real-time observability integrates MELT data streams into a unified backend that supports live dashboards, alerting, and automated analysis. This holistic view is what enables faster detection and deeper understanding of complex interactions in microservices architectures. For foundational context, notable sources describe the MELT model and the distinction between observability and monitoring, emphasizing that monitoring answers the when and what, while observability answers the why and how the issues occur.
Key reference points in the industry describe how real-time telemetry empowers fast incident detection and root-cause analysis, with traces playing a crucial role in distributed systems. Insights from cloud providers and observability platforms highlight real-time correlation across MELT data to reduce MTTR and improve reliability.
2) The architecture of real-time observability
A practical real-time observability stack typically follows a streaming pipeline pattern. While implementations vary, the architecture generally includes:
- Instrumentation: Code-level and service-level instrumentation to emit metrics, logs, events, and traces (often via OpenTelemetry or equivalent libraries). OpenTelemetry is widely adopted for consistent, vendor-agnostic telemetry collection.
- Telemetry transport: A scalable message bus or streaming platform (e.g., Apache Kafka, AWS Kinesis) to transport streams of MELT data with low latency.
- Telemetry processing: Real-time processing and enrichment (e.g., correlation IDs, enrichment from configuration management, anomaly detection) using stream processing engines or compute pipelines.
- Storage and indexing: Efficient time-series databases for metrics, log stores, and trace backends for long-term retention and query performance.
- Visualization and alerting: Dashboards, alerting rules, and AI-assisted analytics that surface actionable insights and reduce noise.
OpenTelemetry provides a streamlined path to consistent telemetry across services, simplifying the choice of backends and improving data quality for real-time analysis. This standardization is a major factor in achieving reliable end-to-end visibility.
In real-world practice, teams should design telemetry pipelines with privacy, security, and cost in mind. Streaming data at sub-second granularity can be powerful but must be governed to avoid unnecessary data duplication and to protect sensitive information. Cloud providers and vendors emphasize the importance of integrating data gating, access control, and data retention policies as part of the architecture.
3) Why real-time observability matters for reliability and business outcomes
There are several tangible benefits to real-time observability, particularly for organizations operating distributed services and customer-facing experiences:
- Faster incident detection: Real-time telemetry enables quicker anomaly detection and alerting, reducing MTTD and accelerating response. Systems that watch real-time data can identify deviations from expected behavior more rapidly than retrospective analysis alone.
- Faster root-cause analysis: End-to-end traces show how a request traverses services, making it easier to pinpoint where a problem originates and how it propagates. This is especially valuable in microservices architectures.
- Proactive reliability using SLIs/SLOs: Observability supports defining and tracking service-level indicators and objectives, allowing teams to react before user impact occurs and to forecast capacity and reliability needs.
- Reduced alert fatigue and improved learning: A disciplined approach to alerting, coupled with blameless postmortems, improves response quality and organizational learning, helping prevent repeated outages.
- Business alignment: Real-time observability ties technical signals to user experience and business impact, enabling teams to quantify improvements in customer satisfaction, conversion, or revenue. Innovative reporting frameworks like XLOs (experience-level objectives) are gaining traction as a user-centric evolution of traditional SLIs/SLOs.
Leading industry sources emphasize that modern observability is not merely about data collection; it’s about turning data into timely, actionable decisions that prevent outages and protect user trust. In practice, this means focusing on outcome-oriented telemetry and embedding observability into the culture and processes of the organization.
4) Alerting, incident response, and the culture of learning
Real-time observability thrives when combined with disciplined incident response and a culture that values learning over blame. The best practice playbooks emphasize:
- Blameless postmortems: After significant incidents, write postmortems that focus on system design, processes, and data, not on blaming individuals. This encourages openness and continual improvement. Prominent SRE literature and industry guidance advocate blamelessness as a foundational principle for reliability.
- Structured incident reviews: Use standardized templates, timelines, and visuals (graphs, traces) to communicate what happened, how it was resolved, and what changes will reduce future risk.
- Actionable postmortems: Each incident review should generate concrete preventive actions tied to owner teams, with clear success criteria and due dates.
- Threat modeling and disaster drills: Regularly test incident runbooks and disaster recovery plans to validate resilience under real-world conditions.
The Google SRE guidance on postmortems and blameless culture remains a widely cited reference for how to structure learning from failure. Modern practitioners also stress the value of sharing learnings across teams to reduce the probability of recurrence.
Practical tip: Build a lightweight postmortem process first. Trigger a postmortem after any incident that meets a defined threshold (for example, user-visible downtime, data loss, or significant recovery time). Then progressively codify templates, review cycles, and sharing channels. This approach creates a sustainable foundation for blameless learning.
5) Practical guidelines to implement real-time observability
Use the following steps to design and implement a real-time observability program that delivers measurable value without overwhelming your teams:
- Define business-driven goals and SLIs/SLOs: Start with user-centric objectives (e.g., page load time under 2 seconds for 99.9% of users, or checkout success rate above 99.5%). Map these to service-level indicators (SLIs) and service-level objectives (SLOs) to create a visible North Star for reliability. This practice is widely recommended in modern observability discussions and aligns technical signals with business outcomes.
- Instrument with MELT: Implement metrics, events, logs, and traces across critical services. Use OpenTelemetry where possible to ensure consistency and easier migration between backends.
- Choose a scalable streaming backbone: Route telemetry through a robust streaming platform (e.g., Kafka, Kinesis) to enable real-time processing, filtering, and enrichment. This reduces latency and enables streaming analytics and alerting.
- Build real-time processing and alerting: Implement real-time anomaly detection (thresholds, statistical methods, or ML-based approaches) and design alerts that trigger on meaningful deviations without overwhelming on-call engineers. Real-time capabilities are a core differentiator for modern observability platforms.
- Correlate across MELT for fast root cause analysis: Use traces to connect front-end user-facing issues to downstream services, logs for context, and metrics for performance baselines to find root causes quickly. The value of end-to-end tracing for distributed systems is well established.
- Embed governance, security, and privacy: Implement data access controls, retention policies, and data minimization at the source. Real-time data volumes demand thoughtful governance to protect user privacy and reduce risk.
- Foster a culture of learning: Pair alerting discipline with blameless postmortems, publish learnings, and institutionalize improvements. A strong postmortem culture is a proven driver of reliability.
Optional but valuable: Consider adopting user-experience-focused objectives such as XLOs (Experience-Level Objectives) that emphasize customer-centric quality metrics, not just infrastructure health. Tech media and industry analyses point to XLOs as a future-facing evolution of traditional SLOs.
6) Real-world scenarios: how real-time observability prevents failures
Here are a few practical scenarios where real-time observability makes a tangible difference:
- Commerce platform: A sudden surge in traffic triggers latency spikes across the checkout microservices. Real-time tracing reveals a bottleneck in the payment gateway, enabling a fast failover to a backup processor while alerting the team. The incident is contained before a large percentage of users abandon carts, preserving revenue and trust.
- Content delivery network: A new release introduces a feature flag that interacts with cache keys. Real-time MELT data shows elevated 304-to-200 latency in a subset of regions. Graphs and traces point to a cache miss storm, allowing rapid rollback or feature flag toggling to restore performance.
- Fraud detection in a fintech app: Real-time telemetry detects unusual ordering patterns. ML-based anomaly detection flags a potential threat, and a linked trace helps identify the cascading effects, enabling a rapid containment and audit trail.
These examples illustrate how real-time observability translates into faster resolution, better user experiences, and more reliable business outcomes. The common thread is end-to-end visibility coupled with rapid, informed action.
7) Governance, ethics, and security in real-time observability
Observability data can be sensitive. Real-time pipelines magnify the importance of governance, privacy, and security considerations:
- Access control: Enforce role-based access controls (RBAC) and least-privilege principles for dashboards, backends, and data dumps.
- Data minimization and retention: Collect only what you need for debugging and performance optimization, and define retention windows aligned with regulatory and business needs.
- Data obfuscation and masking: Apply masking for PII in logs and traces where appropriate, especially in multi-tenant environments.
- Security in streaming: Ensure that streaming data paths are encrypted in transit and at rest, and monitor for unusual access patterns or data exfiltration risks.
Industry guidance emphasizes that observability isn’t just about technical excellence; it’s also about building trustworthy, secure, and privacy-minded telemetry ecosystems. When teams pair telemetry with strong governance, they reduce risk while maintaining the speed and clarity needed for real-time decision-making.
8) Putting it all together: a starter plan
If you’re beginning a real-time observability journey, here’s a compact, actionable plan you can adapt:
- Set business-aligned goals: Pick 2–3 critical user journeys and define SLIs/SLOs that reflect customer impact (e.g., latency, error rate, time to restore).
- Choose a standard telemetry approach: Adopt MELT with OpenTelemetry for consistent instrumentation across services.
- Build a streaming backbone: Introduce a scalable transport (Kafka, Kinesis) to handle high-velocity telemetry with low latency.
- Implement real-time processing and alerting: Start with simple threshold-based alerts and progressively add ML-based anomaly detection on top of historical baselines.
- Enable rapid root-cause analysis: Invest in end-to-end tracing and correlation of traces with logs and metrics.
- Institutionalize learning: Establish blameless postmortems, share learnings across teams, and tie actions back to system improvements.
- Review governance: Archive a simple policy for data access, retention, and privacy; run regular audits and security reviews.
Following this plan helps teams move from data collection to data-driven, real-time decision-making. It also aligns reliability work with business outcomes and fosters a culture of continuous improvement.
Conclusion
Real-time observability is the backbone of modern reliability engineering. By harmonizing metrics, events, logs, and traces into a streaming, real-time fabric, teams can detect anomalies, pinpoint root causes, and prevent critical failures that would otherwise disrupt users and drive up costs. The most effective observability programs are outcome-driven, data-governed, and rooted in a culture of blameless learning and shared accountability.
As you plan or refine your real-time observability strategy, keep the following compass points in mind: define business-oriented SLIs/SLOs; instrument consistently with MELT; embrace real-time streaming for low-latency insights; design alerting to minimize noise; and embed post-incident learning into the fabric of your organization. When done well, real-time observability not only prevents outages – it becomes a strategic advantage, enabling faster delivery of high-quality software and a stronger, more trusted customer experience.
You may also like
DevOps is within reach for SMEs. This practical guide outlines a lean, value-driven approach to auto...

Protecting APIs from leaks requires a defense-in-depth approach: strong authentication, fine-grained...